DJ-Charts - YOOtheme Pro element
DJ-Charts - YOOtheme Pro element v1.0

Views 82
Dev Price € 20
Price € 4
6 Months Free Updates
| Joomla.bid - Files and Versions Directories: 1, Files: 1, Size: 1,48 MB | ||
|---|---|---|
| Name | Extension | Size |
| 1,48 MB | ||
| DJ-Charts - YOOtheme Pro element v1.0_j3x-j4x-j5x | zip | 1,48 MB |
Only registered users can download. Free Registration! Get Free 2 Euro & 6 Months Free Updates Register
Remember to extract zip file!
DJ-Charts is a YOOtheme Pro extension and a chart generator plugin for Joomla. DJ-Charts enables you to create visually stunning charts and graphs effortlessly. Whether you're visualizing complex data trends, presenting statistical information, or elevating your website's aesthetics, DJ-Charts offers an intuitive platform and extensive customization options to bring your ideas to life. Say goodbye to tedious manual chart creation and unleash the full potential of your website with DJ-Charts.
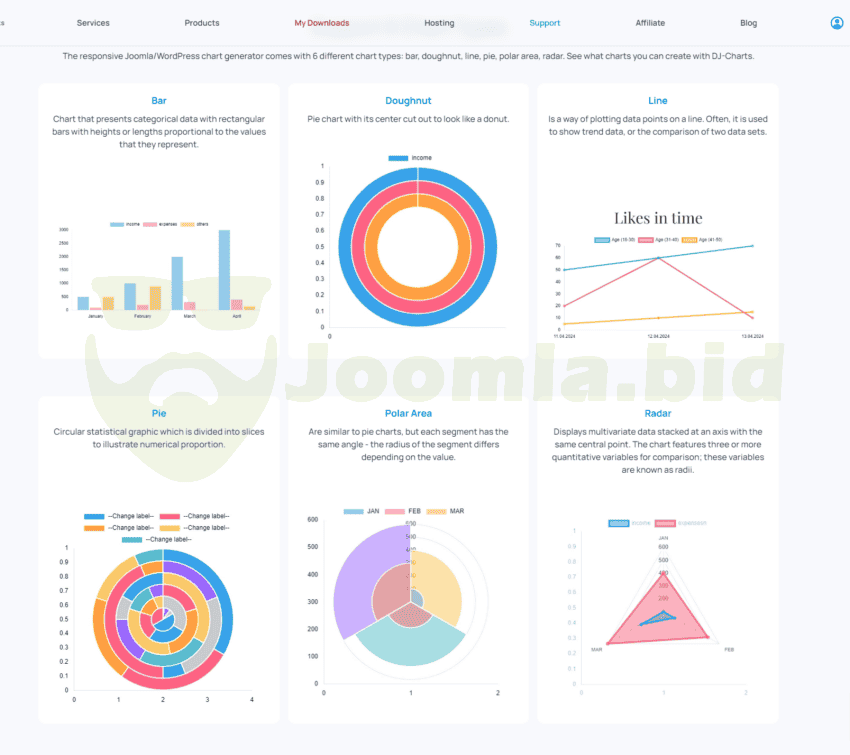
The generator plugin comes with 6 different chart types supported:
- Bar - Chart that presents categorical data with rectangular bars with heights or lengths proportional to the values that they represent.
- Doughnut - Pie chart with its center cut out to look like a donut.
- Line - Is a way of plotting data points on a line. Often, it is used to show trend data, or the comparison of two data sets.
- Pie - Circular statistical graphic which is divided into slices to illustrate numerical proportion.
- Polar area - similar to pie charts, but each segment has the same angle - the radius of the segment differs depending on the value.
- Radar - Displays multivariate data stacked at an axis with the same central point. The chart features three or more quantitative variables for comparison; these variables are known as radii.
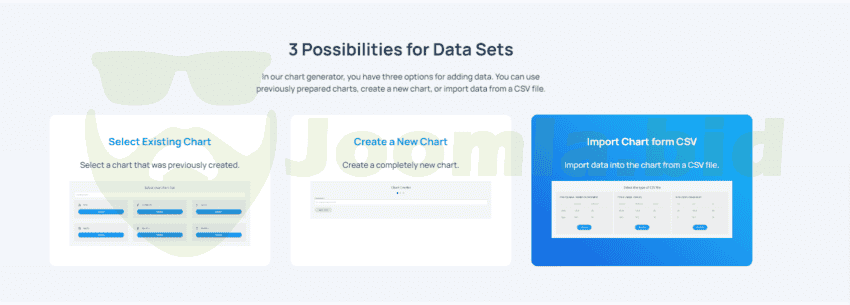
The chart generator comes with three ways of adding data:
- Previously prepared charts
- Creating a new chart
- Improting data from a CSV file
“REWARDS PROGRAM | WE PAY TO YOUR WALLET”
1 Euro for any new or updated item you share with us. *Read Rules
Get 50 Cents for every review you add.
Get 50 Cents for every review you add.
We’d love to hear how satisfied with your download, please give it a rate of stars and leave a review. We will be grateful.
(2 reviews per day, we pay only if the item is downloaded)